
The robot gap: Korea has 7 times the world’s robot density


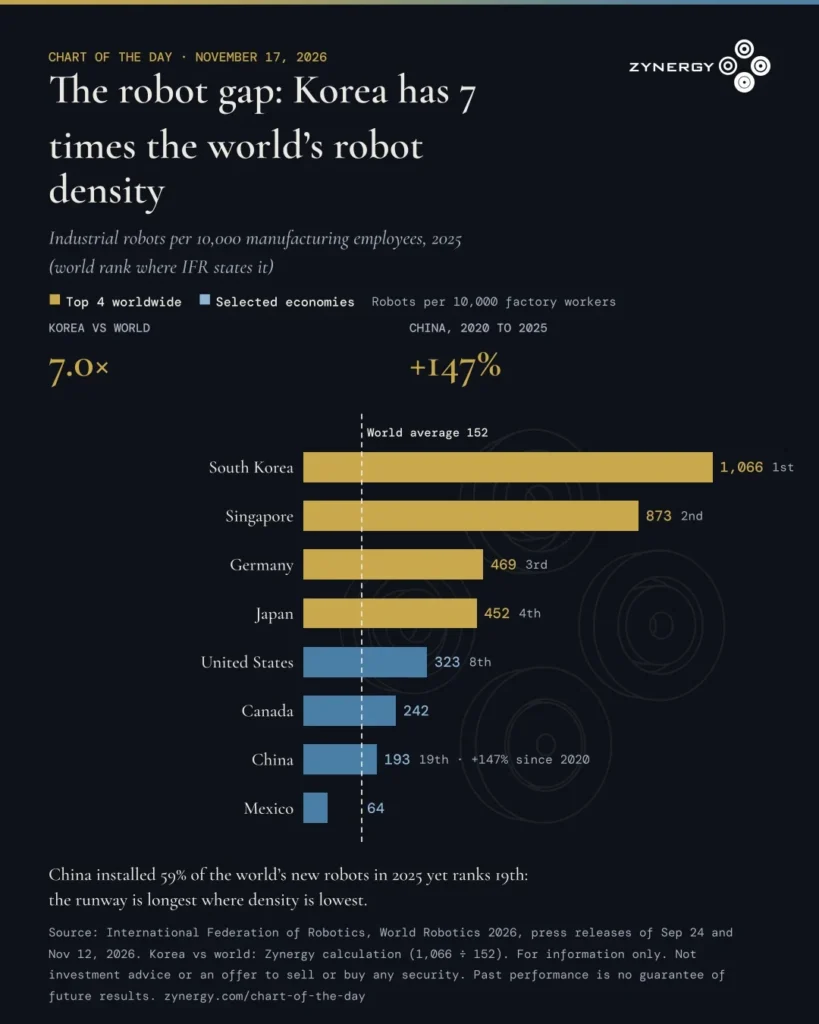
Bar chart: industrial robots per 10,000 manufacturing employees in 2025. South Korea 1,066 (1st), Singapore 873 (2nd), Germany 469 (3rd), Japan 452 (4th), United States 323 (8th), Canada 242, China 193 (19th, up 147% since 2020), Mexico 64. World average 152; Korea is 7.0 times the world average. Source: International Federation of Robotics, Nov 12, 2026.
Industrial robots per 10,000 manufacturing employees, 2025 (world rank where IFR states it)

The takeaway

In 2025 South Korea ran 1,066 industrial robots per 10,000 manufacturing employees, 7 times the world average of 152, followed by Singapore at 873, Germany at 469 and Japan at 452, according to the International Federation of Robotics. The United States ranked 8th at 323 and China 19th at 193, even though China’s density rose 147% from 2020 to 2025 and China installed 59% of the world’s new industrial robots in 2025. Density measures how far factories have automated, not productivity or profit, but the gap between the leaders and the rest shows where adoption still has the most room to grow.

More charts like this one are on Chart of the Day, and our wider research is in Insights.

Source: International Federation of Robotics, World Robotics 2026, press releases “Robot Density Highest in South Korea, Singapore and Germany” (Nov 12, 2026) and “Five Million Robots now Operate in Factories Globally” (Sep 24, 2026). Korea vs the world average is Zynergy’s calculation (1,066 ÷ 152).

For information only. Not investment advice or an offer to sell or buy any security. Past performance is no guarantee of future results.

The chart in 5 slides

1 / 5
  1. Chart of the Day, 2026-11-17: The robot gap: Korea has 7 times the world’s robot density. South Korea runs 1,066 industrial robots for every 10,000 factory workers. The world average is 152.
  2. The chart: Bar chart: industrial robots per 10,000 manufacturing employees in 2025. South Korea 1,066 (1st), Singapore 873 (2nd), Germany 469 (3rd), Japan 452 (4th), United States 323 (8th), Canada 242, China 193 (19th, up 147% since 2020), Mexico 64. World average 152; Korea is 7.0 times the world average. Source: International Federation of Robotics, Nov 12, 2026.
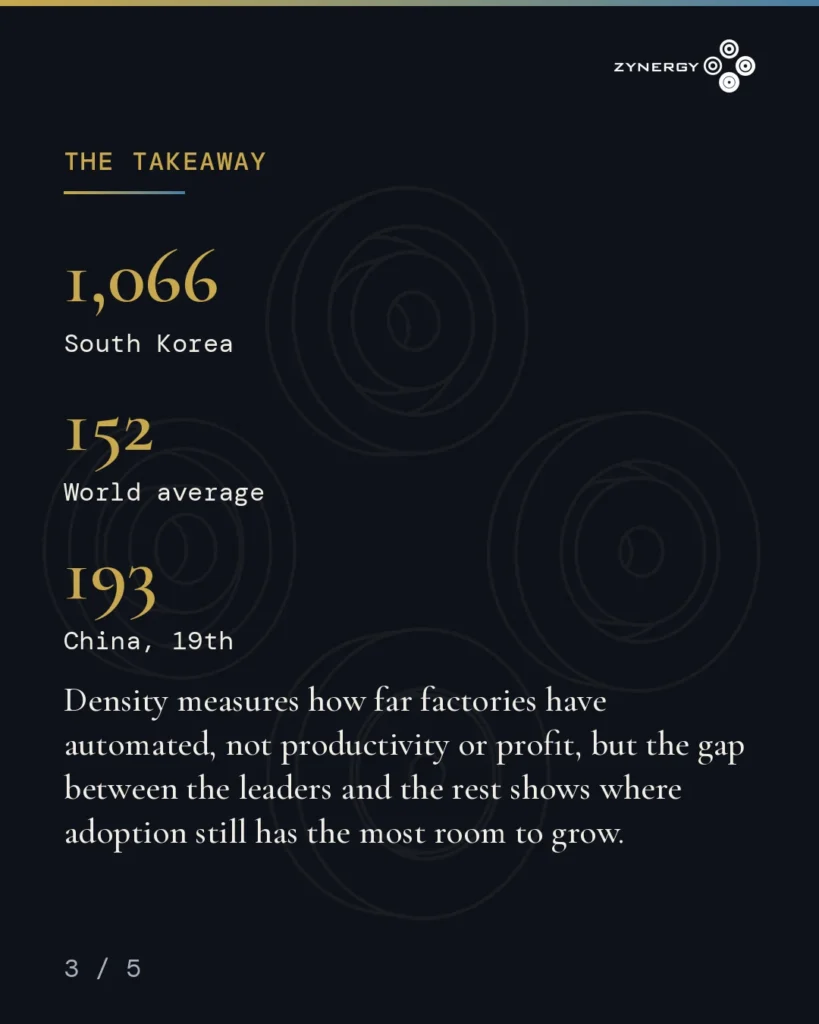
  3. The takeaway: industrial robots per 10,000 factory workers, 2025: 1,066 South Korea; 152 World average; 193 China, 19th. Density measures how far factories have automated, not productivity or profit, but the gap between the leaders and the rest shows where adoption still has the most room to grow.
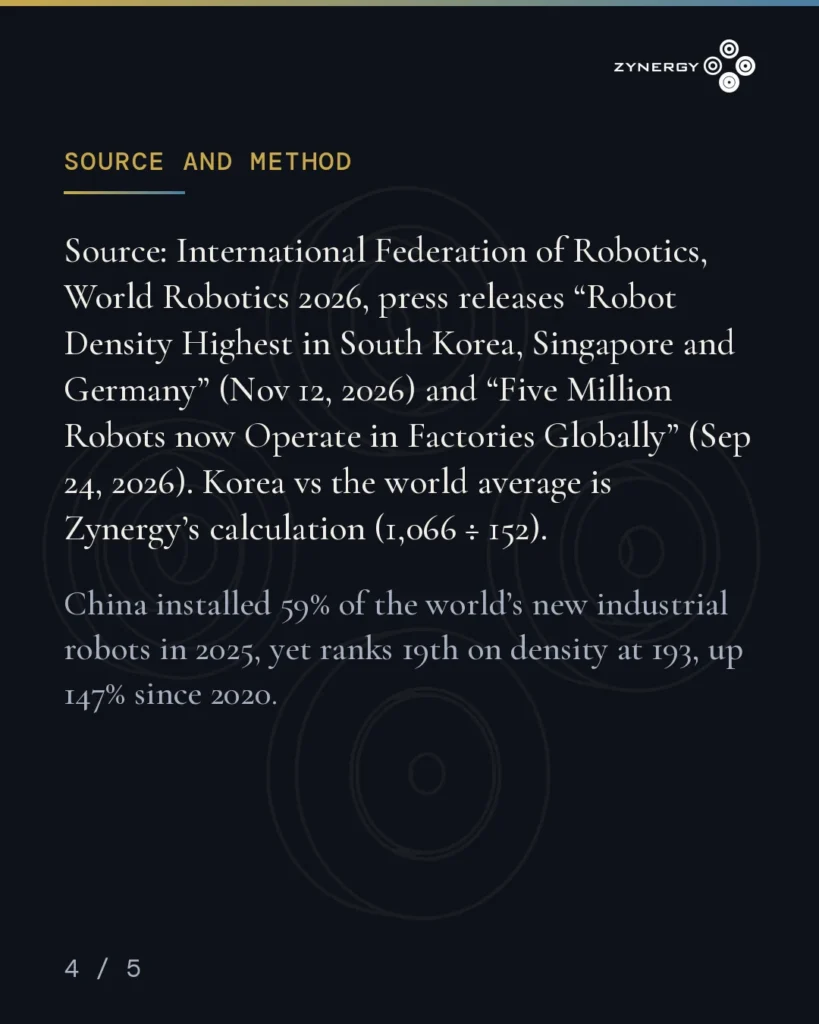
  4. Source and method. Source: International Federation of Robotics, World Robotics 2026, press releases “Robot Density Highest in South Korea, Singapore and Germany” (Nov 12, 2026) and “Five Million Robots now Operate in Factories Globally” (Sep 24, 2026). Korea vs the world average is Zynergy’s calculation (1,066 ÷ 152). China installed 59% of the world’s new industrial robots in 2025, yet ranks 19th on density at 193, up 147% since 2020.
  5. Follow Zynergy for the Chart of the Day at zynergy.com/chart-of-the-day. For information only. Not investment advice.
Read the slides as text
  1. The chart: Bar chart: industrial robots per 10,000 manufacturing employees in 2025. South Korea 1,066 (1st), Singapore 873 (2nd), Germany 469 (3rd), Japan 452 (4th), United States 323 (8th), Canada 242, China 193 (19th, up 147% since 2020), Mexico 64. World average 152; Korea is 7.0 times the world average. Source: International Federation of Robotics, Nov 12, 2026.
  2. The takeaway: industrial robots per 10,000 factory workers, 2025: 1,066 South Korea; 152 World average; 193 China, 19th. Density measures how far factories have automated, not productivity or profit, but the gap between the leaders and the rest shows where adoption still has the most room to grow.
  3. Source and method. Source: International Federation of Robotics, World Robotics 2026, press releases “Robot Density Highest in South Korea, Singapore and Germany” (Nov 12, 2026) and “Five Million Robots now Operate in Factories Globally” (Sep 24, 2026). Korea vs the world average is Zynergy’s calculation (1,066 ÷ 152). China installed 59% of the world’s new industrial robots in 2025, yet ranks 19th on density at 193, up 147% since 2020.
  4. Follow Zynergy for the Chart of the Day at zynergy.com/chart-of-the-day. For information only. Not investment advice.

Was this insight valuable?

Zynergy Insights

Get the research first.

New research, videos and podcast episodes from Zynergy, delivered to your inbox. Unsubscribe at any time.


Views of others. Zynergy shares thought leadership, research and conversations with guests, contributors and other third parties. Their views and opinions are their own and do not necessarily reflect the views of Zynergy Investments, LP. Zynergy’s own views are as of the date shown and may change without notice.

This content is for informational purposes only and is not investment, legal or tax advice, a recommendation, or an offer to buy or sell any security. Companies, technologies and industries mentioned are illustrative and do not represent all holdings; Zynergy and its affiliates may hold positions in securities discussed. Past performance is not indicative of, and is no guarantee of, future results. Full disclosures.

Get in touch

Start a conversation with our team.

We welcome conversations with family offices, founders, researchers and fellow innovators in AI and technology. Tell us about yourself and we will follow up.