


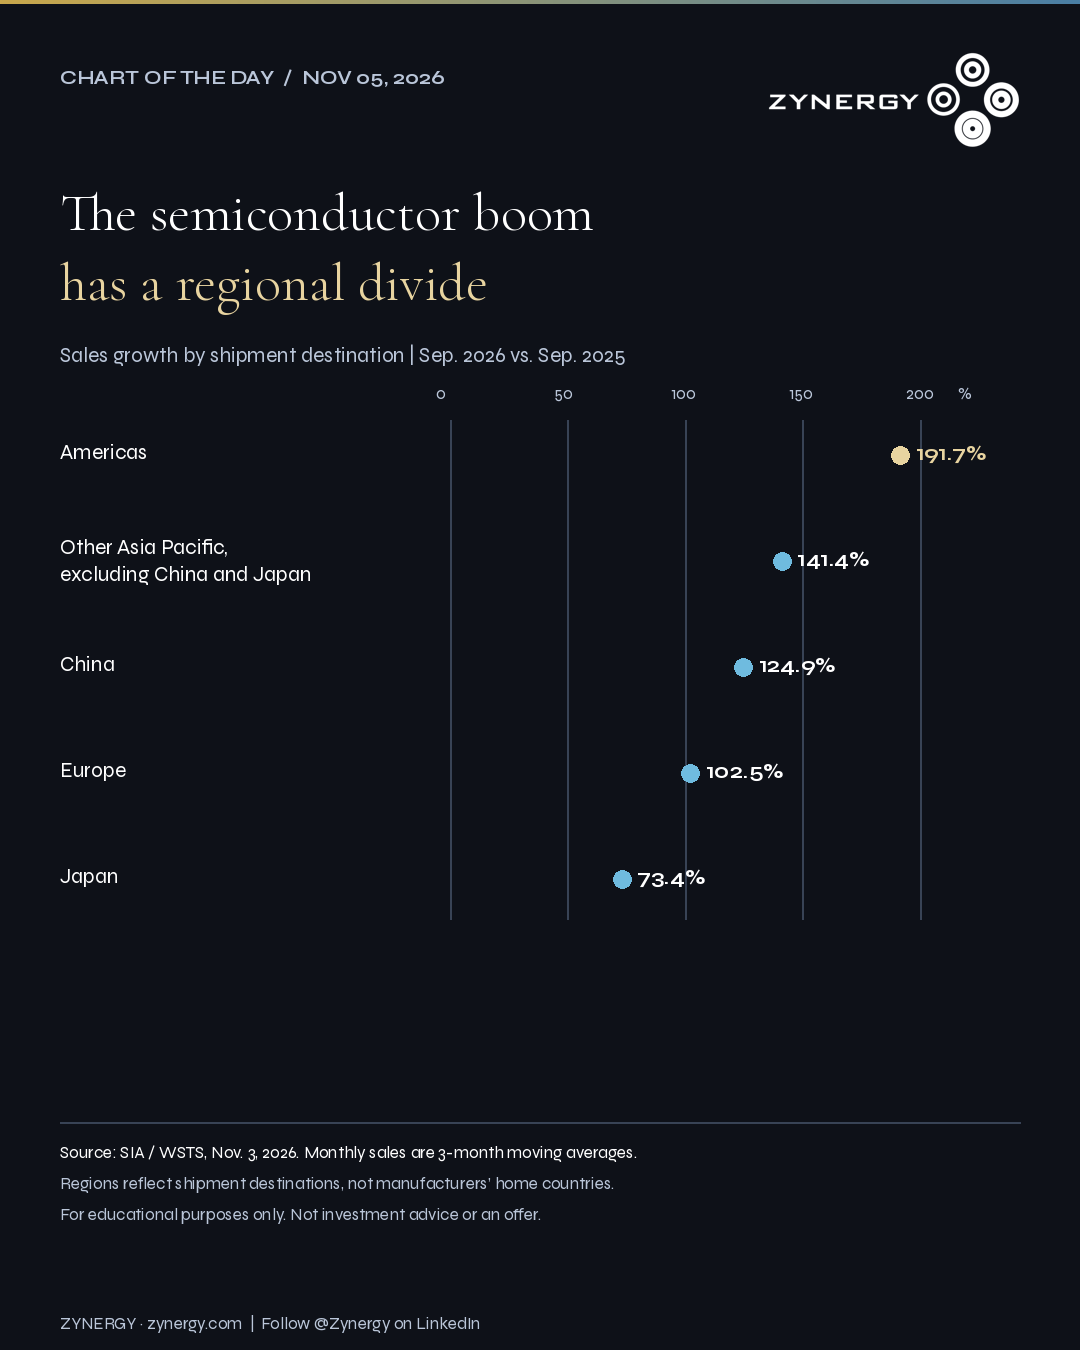
Chart of the Day | November 5, 2026. Semiconductor sales growth varies sharply across shipment destinations. The latest SIA/WSTS figures place the Americas first and Other Asia Pacific, excluding China and Japan, second by year-over-year growth.
The regional comparison
| Shipment destination | Year-over-year sales growth |
|---|---|
| Americas | 191.7% |
| Other Asia Pacific, excluding China and Japan | 141.4% |
| China | 124.9% |
| Europe | 102.5% |
| Japan | 73.4% |
The highest-to-lowest gap is 118.3 percentage points, calculated as 191.7 minus 73.4. This compares growth rates, rather than market shares or investment returns. Figures refer to September 2026 versus September 2025 and were published on November 3, 2026.
Why China is separate, and where Korea fits
WSTS reports China and Japan separately. Its published regional definition includes Korea, Taiwan, Singapore, Malaysia, India and other Asian markets, plus Australia and New Zealand, within the remaining Asia Pacific category. Regions follow shipment destinations, not the manufacturer’s headquarters or fabrication location. A Korean supplier’s shipment to China therefore belongs to China in this framework.
The public regional release does not quantify South Korea’s contribution. The category’s second-place growth ranking cannot establish which country drove it.
What investors should examine next
Zynergy’s interpretation: regional momentum is a starting point for diligence. Product mix, pricing, customer concentration and prior-year comparisons require examination before attributing growth to AI demand or a particular supplier. For context, read our perspective on AI infrastructure investment.
Sources and methodology
Original visualization by Zynergy using published numerical facts from the SIA November 3 release and its linked data table. Regional definitions: WSTS classification guide, page 26; current country-report coverage: WSTS Market Statistics. The historical bases in the latest release differ from the original 2025 release. Published growth rates are retained; calculations using displayed rounded dollars can differ slightly. These are historical observations, with no forecast or country-contribution estimate.
For informational purposes only. Not an offer to sell or a solicitation of an offer to buy any security. Investments are available only to accredited investors through official offering documents. Past performance does not guarantee future results. Investing involves risk, including loss of principal.