

Global semiconductor sales are accelerating, but not uniformly. The geographic split in September’s year-over-year growth illustrates why investors should look beneath the global headline.
One industry, five different growth rates
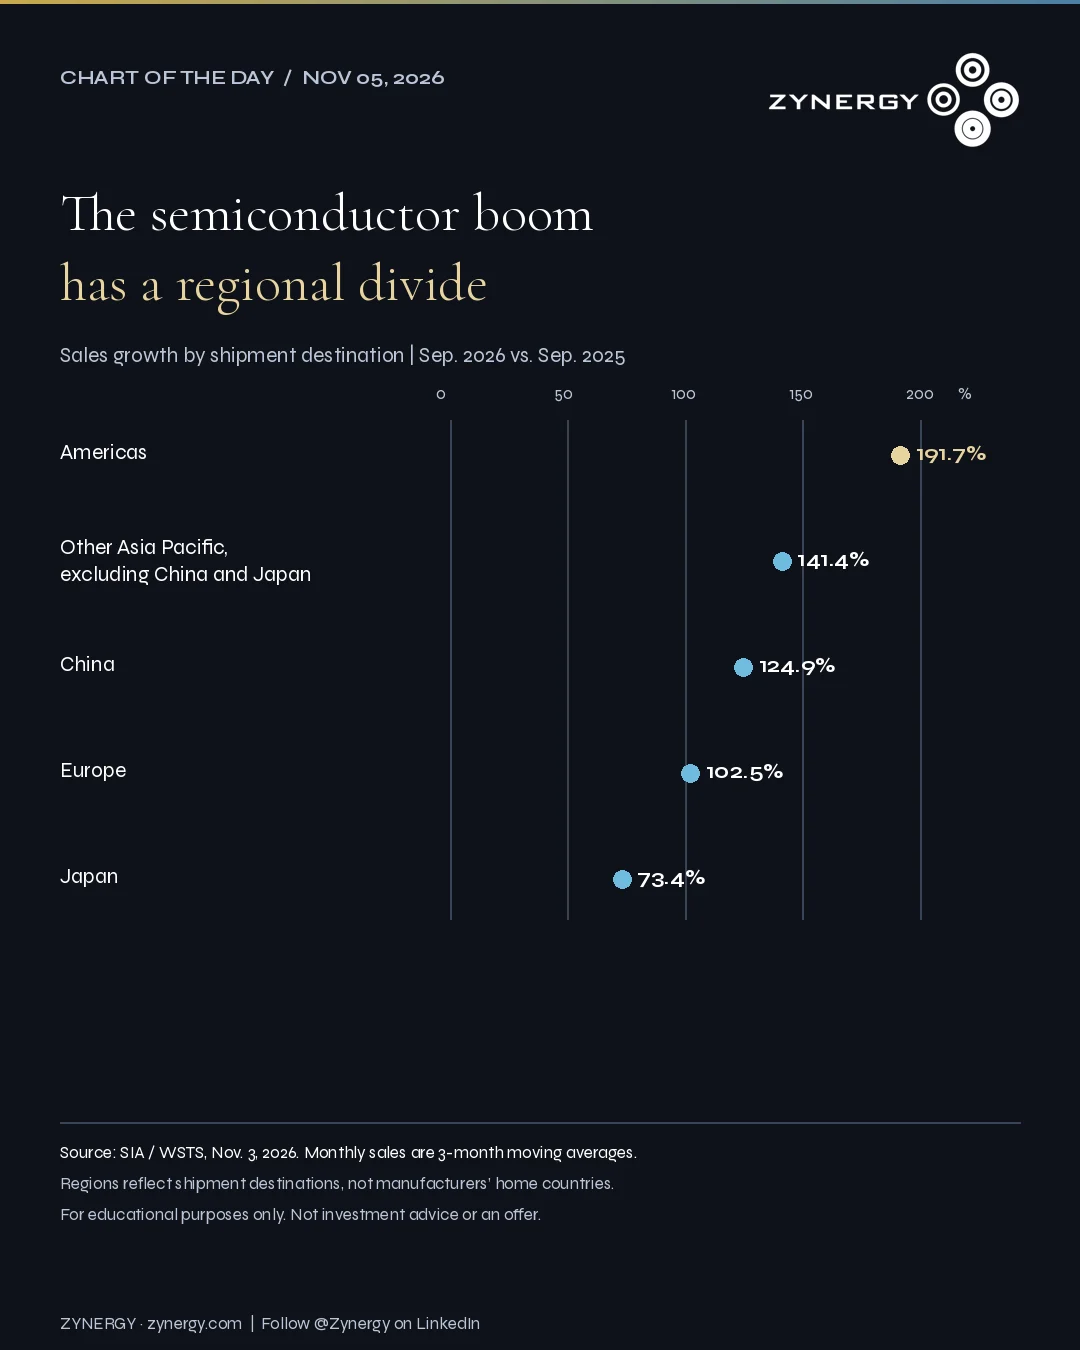
According to the Semiconductor Industry Association (SIA), September 2026 semiconductor sales rose 191.7% from a year earlier in the Americas, followed by Asia Pacific/All Other (141.4%), China (124.9%), Europe (102.5%), and Japan (73.4%).
The global figure was equally striking: September sales reached $172.6 billion, up 146.8% year over year. For the third quarter as a whole, worldwide semiconductor sales were $517.7 billion, up 24.1% from the preceding quarter.
What the geographic divergence tells us
These figures are regional semiconductor sales markets, not a ranking of where chips were manufactured or where their suppliers are headquartered. SIA presents China and Japan as separate regions from its Asia Pacific/All Other category. These regional figures should therefore not be interpreted as national manufacturing performance.
For investors, the difference is material. Faster reported growth in one regional market does not necessarily imply that companies based there capture the greatest incremental profits. Product mix, pricing, customer concentration, supply-chain location, and competitive position all require separate analysis.
The investment question
The more useful question is not simply whether the semiconductor industry is growing. It is where demand is appearing, which firms can convert that demand into durable earnings, and whether the growth can be sustained.
AI infrastructure investment may be one driver of semiconductor demand, but these regional figures alone do not establish how much of the growth comes from AI, memory prices, shipment volumes, or any specific industry. They are a starting point for diligence, not a complete investment thesis.
Chart takeaway: Global growth can hide meaningful regional differences. The next step is to understand what sits behind the percentages.
Source and methodology
Primary source: Semiconductor Industry Association, “Global Semiconductor Sales Increase 24.1% from Q2 2026 to Q3 2026”, published November 3, 2026, using World Semiconductor Trade Statistics (WSTS) data. September figures are three-month moving averages, and the regional percentages compare September 2026 with September 2025. The chart uses SIA’s separate published regional categories. Sales growth is not the same as stock returns or semiconductor production growth.
For informational and educational purposes only. This content is not investment advice, an offer to sell, or a solicitation to buy any security or private-fund interest. Investing involves risk.